Mastery of Knowledge & Skills
Claim #1 Evidence
FCE student growth and performance rates are higher than both district and state.
"It's clear that the initial data shows that Fox Creek student's are growing at double the rate of similar schools within the district."
Christy Lyle, School Accountability Council member

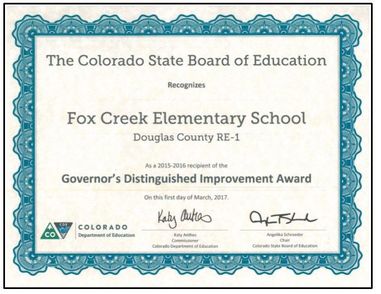
Governor's Distinguished Improvement Award:
Fox Creek Elementary was awarded the Governor’s Distinguished Improvement Award in March 2017. This award is given to schools that demonstrate exceptional student growth by “Exceeding expectations on the indicator related to longitudinal academic growth and “meet or exceed” expectations on the indicator related to academic growth gaps” . Out of 64 Elementary schools in Douglas County School District, Fox Creek was one of five elementary school recipients to receive this award. |
click the image to view the full report
|
Colorado Measure of Academic Success (CMAS):
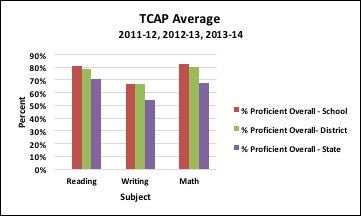
Fox Creek students have consistently performed well when compared to state averages on state mandated standardized tests in reading, writing, and mathematics. Historically (2012-2014), when the state of Colorado mandated the administration of the CSAP/TCAP test, Fox Creek students consistently demonstrated a greater percentage of students scoring proficient or advanced when compared to state and district scores. The last three years of TCAP data (2011-12, 2012-13, and 2013-14) shows that on average 81% of Fox Creek students scored proficient or advanced in reading compared to 79% of students at the district level, and 54% of students at the state level. Additionally, 67% of Fox Creek students scored proficient or advanced on TCAP writing along with 67% of students at the district level while only 54% of students scored proficient or advanced at the state level on average. Finally, the same TCAP data shows that on average 82% of Fox Creek students scored proficient or advanced in math compared to to 80% of students at the district level, and 67% of students at the state level.
Fox Creek students have consistently performed well when compared to state averages on state mandated standardized tests in reading, writing, and mathematics. Historically (2012-2014), when the state of Colorado mandated the administration of the CSAP/TCAP test, Fox Creek students consistently demonstrated a greater percentage of students scoring proficient or advanced when compared to state and district scores. The last three years of TCAP data (2011-12, 2012-13, and 2013-14) shows that on average 81% of Fox Creek students scored proficient or advanced in reading compared to 79% of students at the district level, and 54% of students at the state level. Additionally, 67% of Fox Creek students scored proficient or advanced on TCAP writing along with 67% of students at the district level while only 54% of students scored proficient or advanced at the state level on average. Finally, the same TCAP data shows that on average 82% of Fox Creek students scored proficient or advanced in math compared to to 80% of students at the district level, and 67% of students at the state level.
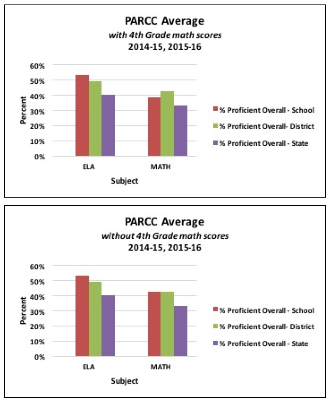
With the introduction of the new CMAS test in 2014/2015, Fox Creek students have continued to outperform their peers at the state and district levels even as the rigor of the test has increased significantly. The two years of CMAS data (2014-15 and 2015-16) shows that on average 54% of Fox Creek students met or exceeded expectations in ELA compared to 49% of students at the district level, and 50% of students at the state level. Additionally, 38% of Fox Creek students scored proficient or advanced in math along with 43% of students at the district level while only 33% of students met or exceeded expectations at the state level on average. Fox Creek’s average math score was heavily impacted by a testing anomaly in the fourth grade in 2015/2016, and with absence of this data point, 43% of students met or exceeded expectations.
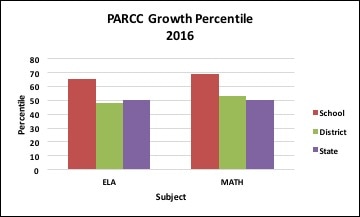
Moreover, in two years of testing, Fox Creek has continued to increase the number of students reaching meeting or exceeding expectations. PARCC growth percentiles in ELA show that 65% of Fox Creek students showed one or more years of growth from 2015 to 2016 compared to only 48% at the district level, and 50% at the state level. Additionally, the growth percentiles in math show that 69% of Fox Creek students showed one or more years growth from 2015 to 2016 when compared to 53% at the district level, and 50% at the state level. Most notably, 89% of Fox Creek’s fifth graders showed one or more years of growth in math from 2015 to 2016.
This success has not come without challenges however. With the introduction of a more complex math series, our fourth grade PARCC scores decreased significantly during the 2015-16 testing window as the teachers worked to implement this more rigorous series. Additionally, having fully implemented learning expeditions, Fox Creek teachers have recognized that not all curriculum standards can be addressed through learning expeditions. Therefore, they have initiated the process of revising learning expeditions, as well as year-long curriculum maps, to better align instruction with the standards. Finally, while Fox Creek has created a comprehensive curriculum map of all the standards across grade levels, we have recognized the need for continuing, in-depth, vertical team planning to better align our learning expectations of students and instructional expectations of grade level teams.
Overall, Fox Creek has demonstrated positive assessment results, even with the more rigorous national and state expectations, due to our implementation of the EL Education’s Core Practices, our vertical alignment of curriculum standards, and our use of thoughtful, student-centered learning targets within our Expeditions and Case Studies. These practices have engaged our students in deep thinking and problem solving. As students have been presented with more rigorous and demanding reading, writing, and mathematics challenges, they have had the knowledge, skills, and character to address these challenges wherein they continue to demonstrate greater proficiency than district or state outcomes.
Overall, Fox Creek has demonstrated positive assessment results, even with the more rigorous national and state expectations, due to our implementation of the EL Education’s Core Practices, our vertical alignment of curriculum standards, and our use of thoughtful, student-centered learning targets within our Expeditions and Case Studies. These practices have engaged our students in deep thinking and problem solving. As students have been presented with more rigorous and demanding reading, writing, and mathematics challenges, they have had the knowledge, skills, and character to address these challenges wherein they continue to demonstrate greater proficiency than district or state outcomes.

NWEA Achievement and Growth:
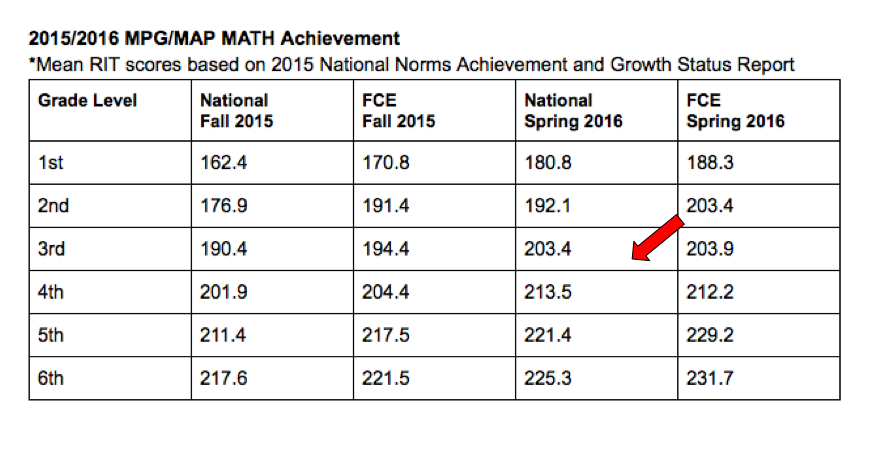
Over the last three years, Fox Creek students grades 1-6 have consistently outperformed national achievement averages in both Math and Reading based upon the Northwest Evaluation Assessment Measuring Academic Progress, (NWEA MAP). This can be observed when reviewing data taken from the 2013/2014, 2014/2015, and 2015/2016 school years.
As this table and consecutive tables illustrate, Fox Creek students begin and end each year above national average expectations. In fact, overall achievement levels have steadily risen each year with at least a half year advanced performance compared to national average ratings and in some grades as much as a two and a half year advanced achievement level.
High achievement scores, typically alter the rate of growth a student can ascertain. In other words, students starting with scores above grade level averages, typically show less growth relative to students starting with lower grade level scores. Therefore, Fox Creek students’ ability to demonstrate growth in the areas of reading and math on the NWEA assessment is less pronounced compared to the high level of achievement observed.
Click image to view other tables.
